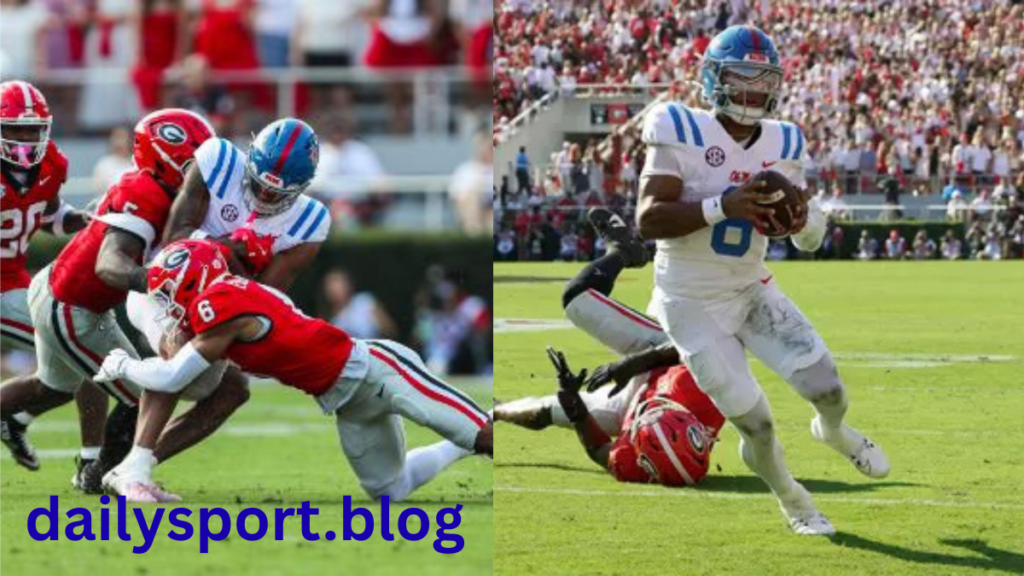
The rivalry between the Ole Miss Rebels and the Georgia Bulldogs consistently delivers some of the most exciting matchups in college football. Whenever these Southeastern Conference powerhouses meet, fans expect elite talent, explosive plays, and standout individual performances. The latest showdown between the two programs lived up to those expectations, producing impressive player statistics and memorable moments that influenced the outcome of the game.
This detailed breakdown explores the key player stats, team performances, offensive leaders, defensive standouts, and the factors that shaped this highly competitive contest. Whether you are a college football fan, analyst, or fantasy football enthusiast, understanding these player statistics provides valuable insight into how the game unfolded.
Match Overview
The matchup featured two nationally ranked programs competing in a crucial SEC battle. Georgia entered the game looking to strengthen its conference position, while Ole Miss aimed to prove it could compete with one of the nation’s elite programs.
Georgia ultimately secured a 43-35 victory over Ole Miss in a high-scoring affair that showcased offensive firepower from both teams. The Bulldogs accumulated 510 total yards compared to Ole Miss’s 351 yards and controlled possession for nearly 38 minutes.
The game remained competitive throughout the first three quarters before Georgia’s balanced offensive attack and efficient execution helped create separation late in the contest.
Team Statistical Comparison
Before diving into individual performances, it’s important to examine the overall team statistics that defined the matchup.
| Category | Ole Miss | Georgia |
|---|---|---|
| Total Yards | 351 | 510 |
| Passing Yards | 263 | 289 |
| Rushing Yards | 88 | 221 |
| First Downs | 21 | 34 |
| Third-Down Efficiency | 5/9 | 6/11 |
| Possession Time | 22:21 | 37:39 |
| Final Score | 35 | 43 |
Georgia’s dominance in rushing yards and time of possession played a significant role in securing the victory. By controlling the clock and consistently moving the chains, the Bulldogs limited Ole Miss’s opportunities to establish offensive rhythm.
Meanwhile, Ole Miss demonstrated explosive potential through its passing game and ability to generate quick scoring drives. However, the Rebels struggled to maintain offensive balance, which ultimately affected their ability to keep pace with Georgia’s methodical attack.
Georgia Bulldogs Offensive Player Stats
Quarterback Performance
Georgia’s quarterback delivered one of his most efficient performances of the season. He completed 21 of 28 passes for 289 yards and two touchdowns while avoiding costly turnovers.
His accuracy on intermediate routes kept the Bulldogs’ offense moving throughout the game. Several key third-down completions extended drives and helped Georgia maintain possession during crucial moments.
The quarterback’s decision-making also stood out. Rather than forcing risky throws, he consistently found open receivers and took advantage of favorable matchups created by the offensive scheme.
Running Back Contributions
Georgia’s running game proved to be a major difference-maker. The Bulldogs accumulated 221 rushing yards, with their lead running backs combining for multiple explosive plays.
The primary ball carrier rushed for over 100 yards while averaging more than five yards per carry. His ability to break tackles and gain yards after contact allowed Georgia to control the pace of the game.
Another running back contributed valuable touches in short-yardage situations and near the goal line. Together, the backfield created a balanced attack that kept the Ole Miss defense guessing.
Wide Receiver Statistics
Georgia’s receiving corps played a crucial role in the victory. Multiple receivers recorded significant contributions, spreading the ball across the offense and preventing Ole Miss from focusing on a single target.
The leading receiver finished with more than 90 receiving yards and a touchdown. His route-running precision and ability to create separation consistently challenged the Rebels’ secondary.
Several additional receivers contributed important catches during scoring drives, demonstrating the depth and versatility of Georgia’s offensive unit.
Ole Miss Rebels Offensive Player Stats
Quarterback Production
Ole Miss’s quarterback showcased his talent despite facing constant pressure from Georgia’s defense. He completed 26 passes for 263 yards and threw for multiple touchdowns.
His ability to extend plays and create opportunities outside the pocket helped the Rebels remain competitive throughout the contest. Several deep passes generated significant gains and energized the offense.
Although the quarterback produced impressive numbers, Georgia’s defensive front forced him into difficult situations, particularly during critical third-down plays.
Running Game Analysis
The Rebels struggled to establish a consistent rushing attack. Finishing with only 88 rushing yards, Ole Miss found it difficult to challenge Georgia’s defensive front.
The lead running back displayed flashes of explosiveness but rarely found clear running lanes. Georgia’s defensive line effectively controlled the line of scrimmage and limited opportunities for long rushing gains.
Without a dominant ground game, Ole Miss became increasingly reliant on passing situations, allowing Georgia’s defense to anticipate offensive tendencies.
Top Receiving Performers
Ole Miss received strong production from its wide receivers. The team’s leading pass catcher surpassed 100 receiving yards and scored a touchdown.
Several explosive receptions helped the Rebels move quickly downfield and create scoring opportunities. The receiving corps consistently challenged Georgia’s secondary and demonstrated why Ole Miss remains one of the conference’s most dangerous passing offenses.
The connection between the quarterback and his top targets was especially evident during the second half, when the Rebels attempted to close the scoring gap.
Georgia Bulldogs Defensive Standouts
Defensive Line Impact
Georgia’s defensive front played a critical role in slowing Ole Miss’s offense. The defensive line generated pressure throughout the game and disrupted the Rebels’ offensive rhythm.
Multiple defenders recorded tackles for loss, limiting rushing opportunities and forcing Ole Miss into unfavorable down-and-distance situations.
The ability to control the line of scrimmage remains one of Georgia’s greatest strengths, and this matchup provided another example of that dominance.
Linebacker Performance
Georgia’s linebackers delivered an outstanding performance against both the run and the pass. They consistently filled running lanes and provided reliable coverage in the middle of the field.
Several linebackers finished with high tackle totals, reflecting their involvement in nearly every defensive series. Their communication and discipline helped prevent Ole Miss from generating sustained momentum.
The linebacker group also contributed important pressures and quarterback hurries, adding another dimension to Georgia’s defensive strategy.
Secondary Contributions
Despite facing a talented passing attack, Georgia’s secondary made several key plays. Defensive backs successfully contested passes and limited explosive opportunities during critical moments.
The unit’s ability to force difficult throws proved especially important in the fourth quarter, when Ole Miss attempted to mount a comeback.
Strong coverage and disciplined positioning helped Georgia protect its lead and secure the victory.
Ole Miss Rebels Defensive Standouts
Defensive Line Effort
Although Georgia accumulated significant offensive production, Ole Miss’s defensive line showed determination throughout the contest.
Several defenders recorded tackles for loss and pressured Georgia’s quarterback on multiple occasions. Their effort helped prevent Georgia from completely dominating the game early.
However, the Bulldogs’ offensive line ultimately won the battle in the trenches, particularly during key rushing situations.
Linebacker Statistics
The Rebels’ linebackers were among the team’s most productive defenders. They accumulated numerous tackles and consistently worked to contain Georgia’s rushing attack.
Their ability to pursue ball carriers and make open-field tackles prevented several potentially explosive plays from becoming even larger gains.
Despite their strong effort, the constant pressure created by Georgia’s balanced offense made the linebackers’ responsibilities increasingly difficult.
Secondary Performance
Ole Miss’s secondary faced one of its toughest challenges of the season. Georgia’s efficient passing game forced defensive backs into frequent coverage situations.
While the unit surrendered several big completions, individual players demonstrated resilience and contributed pass breakups at important moments.
The secondary’s performance highlighted both the challenges of facing an elite offense and the competitive spirit of the Rebels’ defense.
Key Moments That Influenced Player Statistics
Several pivotal moments significantly impacted the final statistical outcomes.
Georgia’s sustained scoring drives allowed the Bulldogs to dominate possession time and accumulate offensive yardage. Long drives not only produced points but also kept Ole Miss’s offense off the field.
Conversely, Ole Miss relied on quick-strike plays and explosive passing gains. While these plays generated impressive individual statistics, they often resulted in shorter possessions.
Turnover avoidance also played a major role. Georgia’s offense protected the football effectively, enabling the team to maximize scoring opportunities and maintain momentum throughout the game.
Offensive Efficiency Comparison
When comparing offensive efficiency, Georgia displayed a more balanced approach. The Bulldogs combined a productive rushing attack with accurate passing, making them difficult to defend.
Ole Miss generated several explosive plays but struggled to achieve the same level of consistency. The lack of rushing production forced the Rebels to depend heavily on their passing game.
This contrast ultimately explains many of the differences seen in the final player statistics. Georgia’s balance created sustainable success, while Ole Miss relied more heavily on individual playmaking ability.
What the Player Stats Reveal
The statistics reveal that Georgia succeeded through balance, efficiency, and control of the game clock. Strong quarterback play, effective rushing, and disciplined defense created a formula for success.
Ole Miss showcased impressive offensive talent, particularly through the air. The Rebels demonstrated their ability to score quickly and challenge elite defenses with explosive plays.
However, the inability to establish a consistent running game and control possession ultimately proved costly. The player stats reflect a team capable of producing highlights but struggling to match Georgia’s overall efficiency.
Conclusion
The Ole Miss Rebels football vs Georgia Bulldogs football match player stats tell the story of a highly competitive SEC showdown. Georgia’s balanced offense, dominant rushing attack, and disciplined defense provided the foundation for a hard-earned victory.
Meanwhile, Ole Miss displayed offensive explosiveness and individual talent that kept the contest exciting until the final stages. Several Rebels players delivered standout performances, particularly in the passing game.
For fans analyzing the matchup, the statistics highlight the importance of balance, possession control, and defensive consistency. While individual performances were impressive on both sides, Georgia’s collective execution ultimately made the difference in one of the season’s most entertaining conference battles.
Frequently Asked Questions
Who won the Ole Miss Rebels vs Georgia Bulldogs football game?
Georgia defeated Ole Miss by a score of 43-35 after controlling possession and producing a balanced offensive performance.
Which team had more total yards in the game?
Georgia finished with 510 total yards, while Ole Miss recorded 351 total yards.
How did Ole Miss perform offensively?
Ole Miss generated 263 passing yards and 88 rushing yards. The Rebels relied heavily on their passing attack to remain competitive.
What was the biggest statistical advantage for Georgia?
Georgia’s biggest advantage was its rushing attack, which produced 221 yards and helped control possession for more than 37 minutes.
Why are player stats important in football analysis?
Player statistics help explain how games are won and lost by highlighting individual contributions, team strengths, offensive efficiency, and defensive effectiveness.
You may also read:
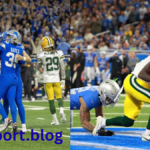
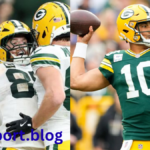
Detroit Lions vs Green Bay Packers Match Player Stats: Complete Performance Breakdown